Bollinger Bands Currency Strength Dashboard
Compare the distance from the Bollinger Bands middle line across forex pairs and timeframes in MT4. Free dashboard with adjustable period and deviation.
What the values mean
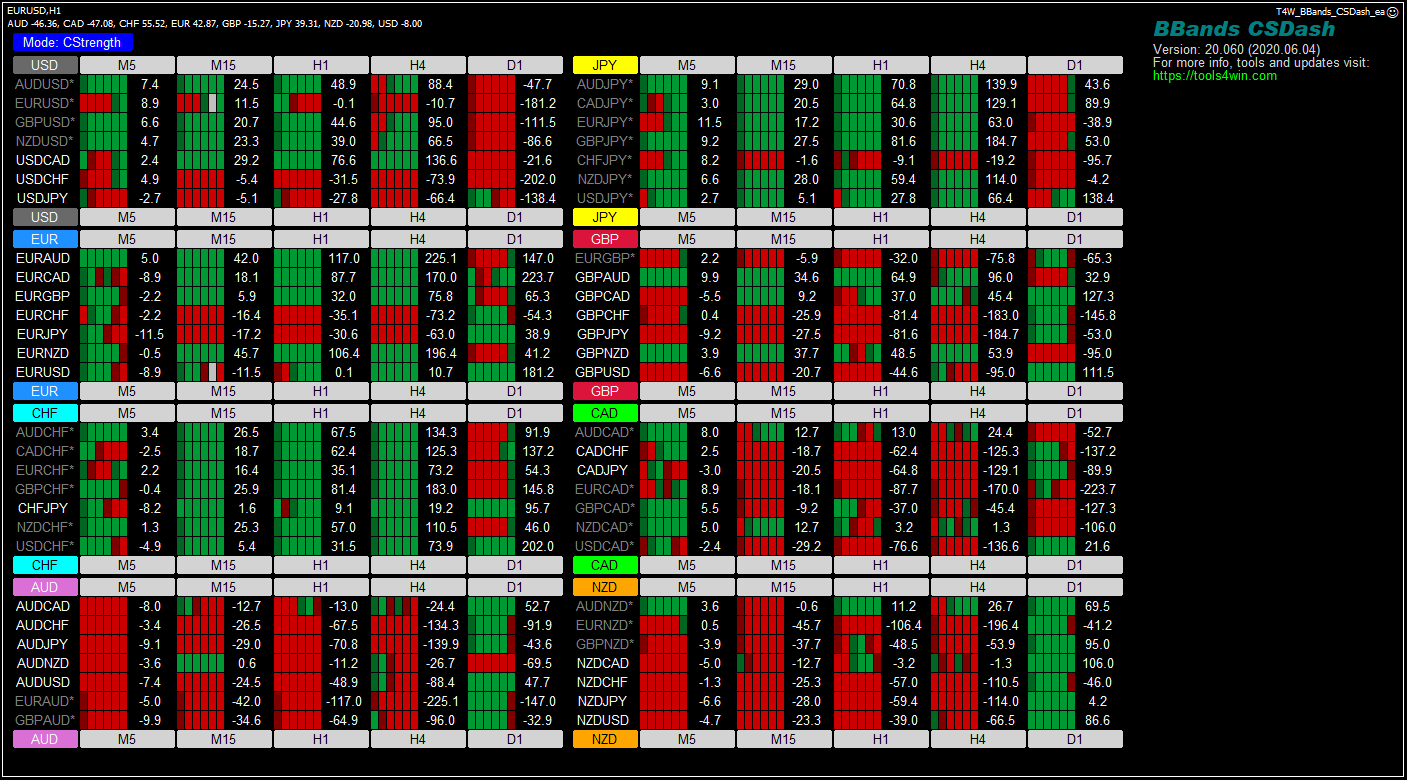
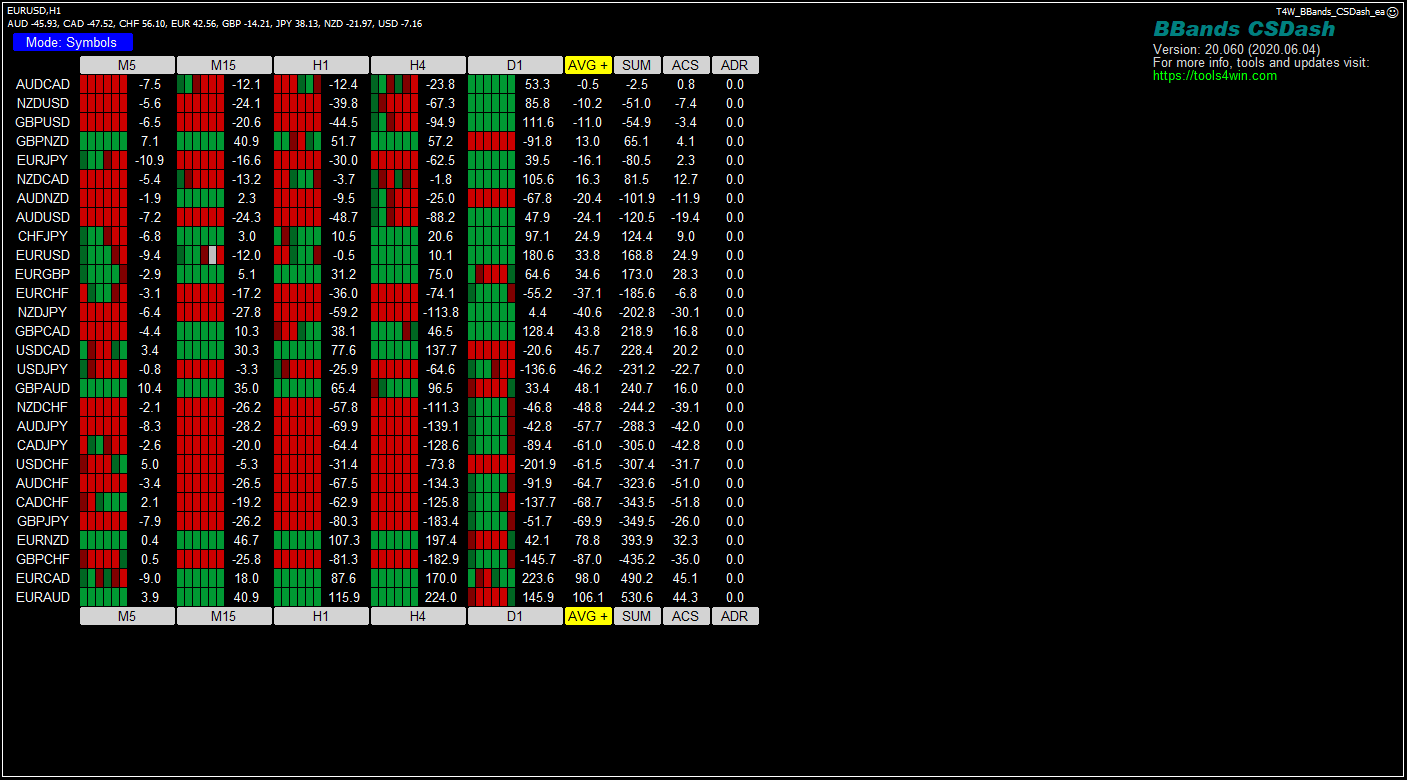
The released dashboard displays the signed distance between the close and the Bollinger Bands middle line in pips. A positive value places the close above the middle line; a negative value places it below. The outer bands provide context for price extremes. The number is not a percentage position between the outer bands.
Settings and interpretation
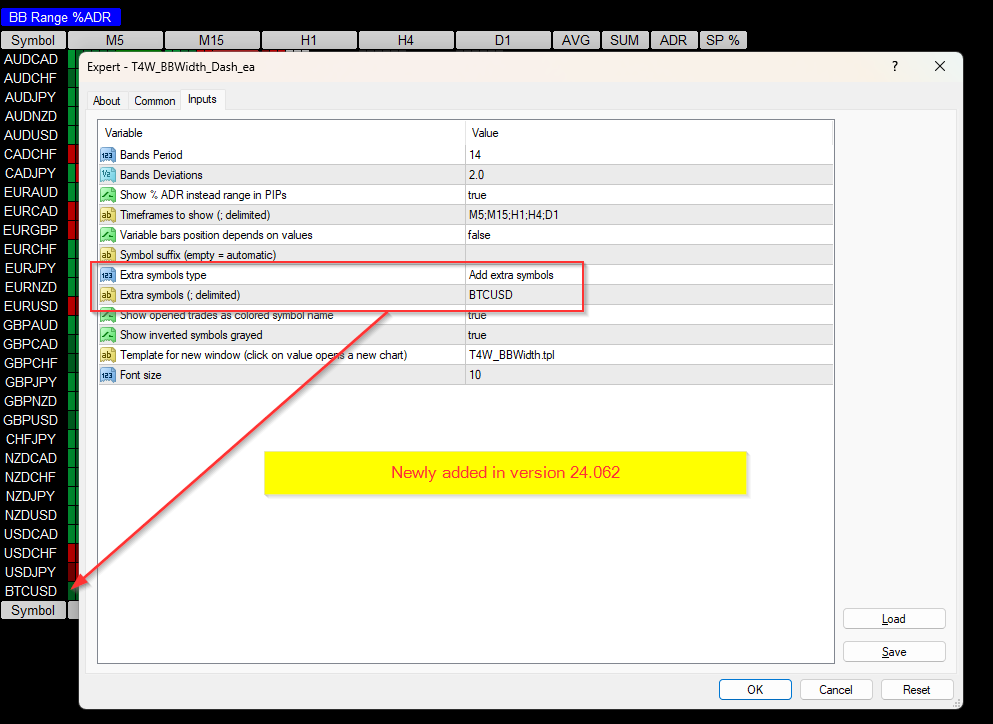
Bands Period defaults to 14 and Bands Deviations to 2. Bands use closing prices with zero shift. The period changes the averaging window; the deviation multiplier changes the width of the outer bands. Choose the timeframes to compare in Inputs.
A touch of an outer band can accompany either continuation or reversal. Compare readings with the chart, and remember that a pip distance is not directly comparable across all instruments. Current-bar values change with price.
Main features
- Signed close-to-middle-band distance in pips.
- Configurable band period and deviation multiplier.
- Multiple symbols, timeframe columns and recent values.
- Chart opening from dashboard values.
- Version
- 24.062
- Released
- 2024-03-20
- Platform
- MT4
- Price
- Free
Download
Download ZIP
t4w_bbands_csdash_ea.zip
Version 24.062 (2024-03-20) · free, no account needed.
The ZIP contains the .ex4 file for MetaTrader 4, screenshots and installation instructions.
New here? Read the installation guide first.