Bollinger Bands Width Dashboard
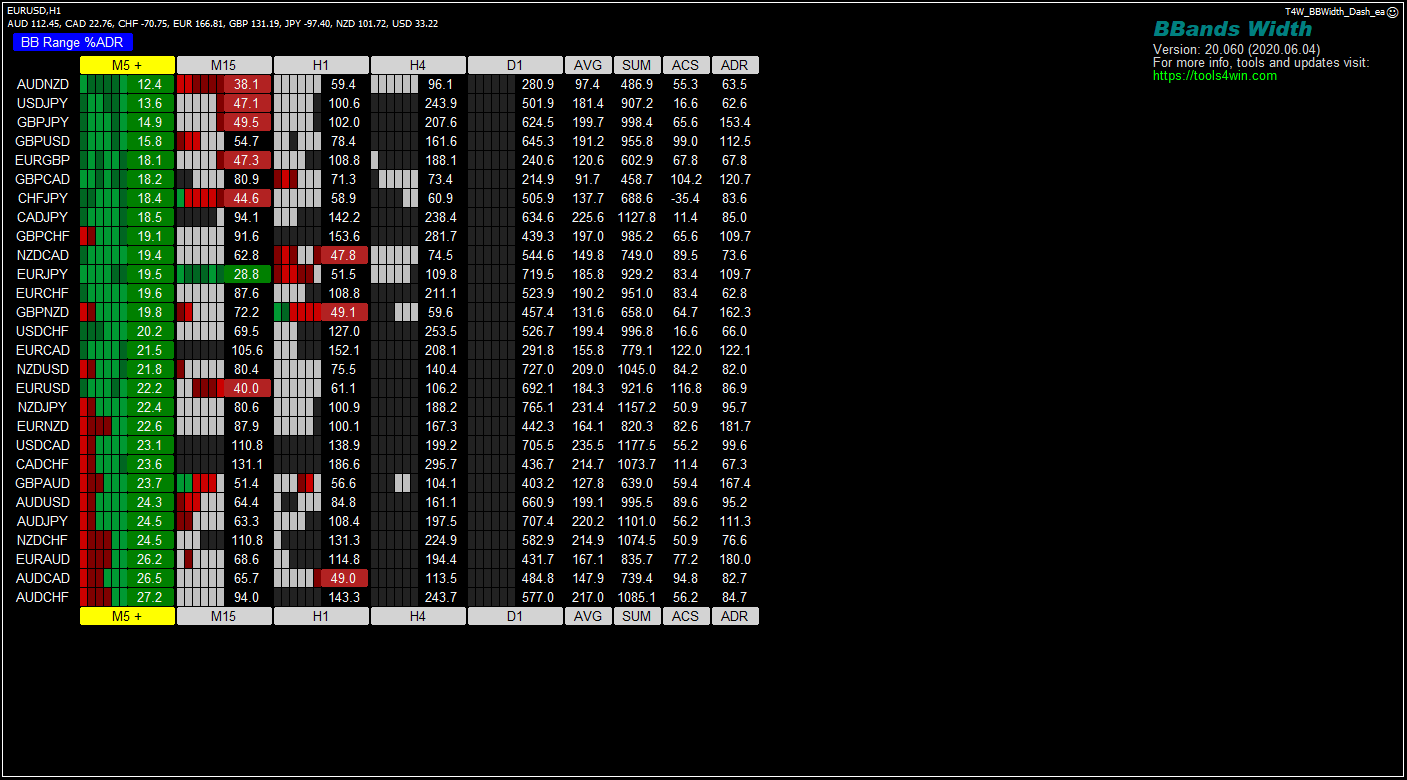
Compare Bollinger Bands width across MT4 symbols and timeframes, in pips or as a percentage of average daily range. A free range dashboard.
What the values mean
Band width is the upper Bollinger Band minus the lower Bollinger Band. The dashboard shows this range in pips or, by default, as a percentage of average daily range (ADR). For example, a width of 20 pips against an ADR of 80 pips is 25% ADR.
Settings and interpretation
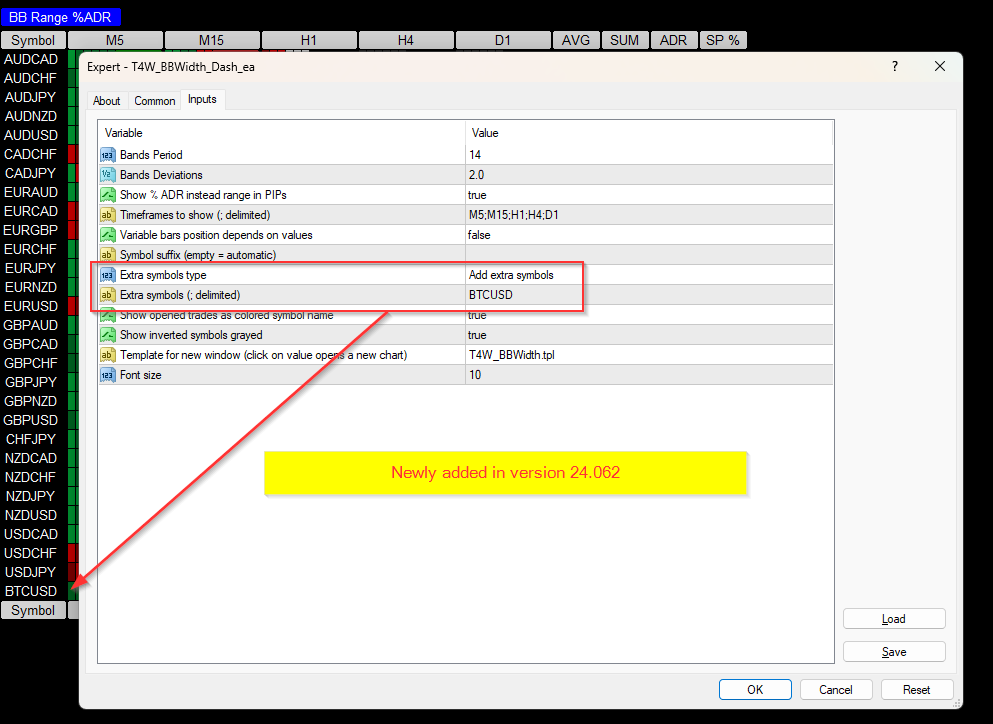
Bands Period defaults to 14 and Bands Deviations to 2, calculated from closing prices. Use Show % ADR instead range in PIPs to select the initial units, and choose the timeframe list in Inputs.
Width measures range, not direction: expanding bands do not tell you whether price will rise or fall. A narrow range does not guarantee an imminent breakout. ADR mode needs enough daily history and a nonzero daily range; compare raw pip widths cautiously across instruments.
Main features
- Upper-to-lower band width for multiple symbols.
- Pip and ADR-relative display modes.
- Adjustable band period, deviation and timeframes.
- Recent width values for comparing contraction and expansion.
- Version
- 24.062
- Released
- 2024-03-20
- Platform
- MT4
- Price
- Free
Download
Download ZIP
t4w_bbwidth_dash_ea.zip
Version 24.062 (2024-03-20) · free, no account needed.
The ZIP contains the .ex4 file for MetaTrader 4, screenshots and installation instructions.
New here? Read the installation guide first.